Infographics
Project Media: data-visualization
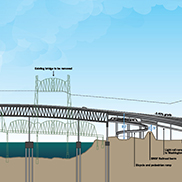
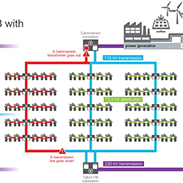
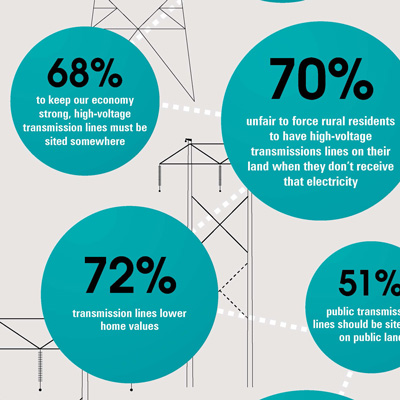
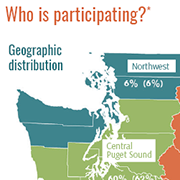
Infographics organize data into succinct visual stories, providing viewers with a quick and clear understanding of any topic. In the first example we used data from an energy survey conducted by EnviroIssues to create a display of essential numerical comparisons at a glance. The second infographic is a simple, visually impactful flow chart of Seattle’s extensive, complicated freight system. Lastly, this diagram shows the many ways in which pollution enters the Duwamish River. Illustrating the information in this way defines each pathway and emphasizes the large number of entry points.